Outcome: Open the intended root, run its applicable baseline, and verify file-based inspection.
Start: M02-L01; CP00 inspection resources and CP01 baseline bundle.
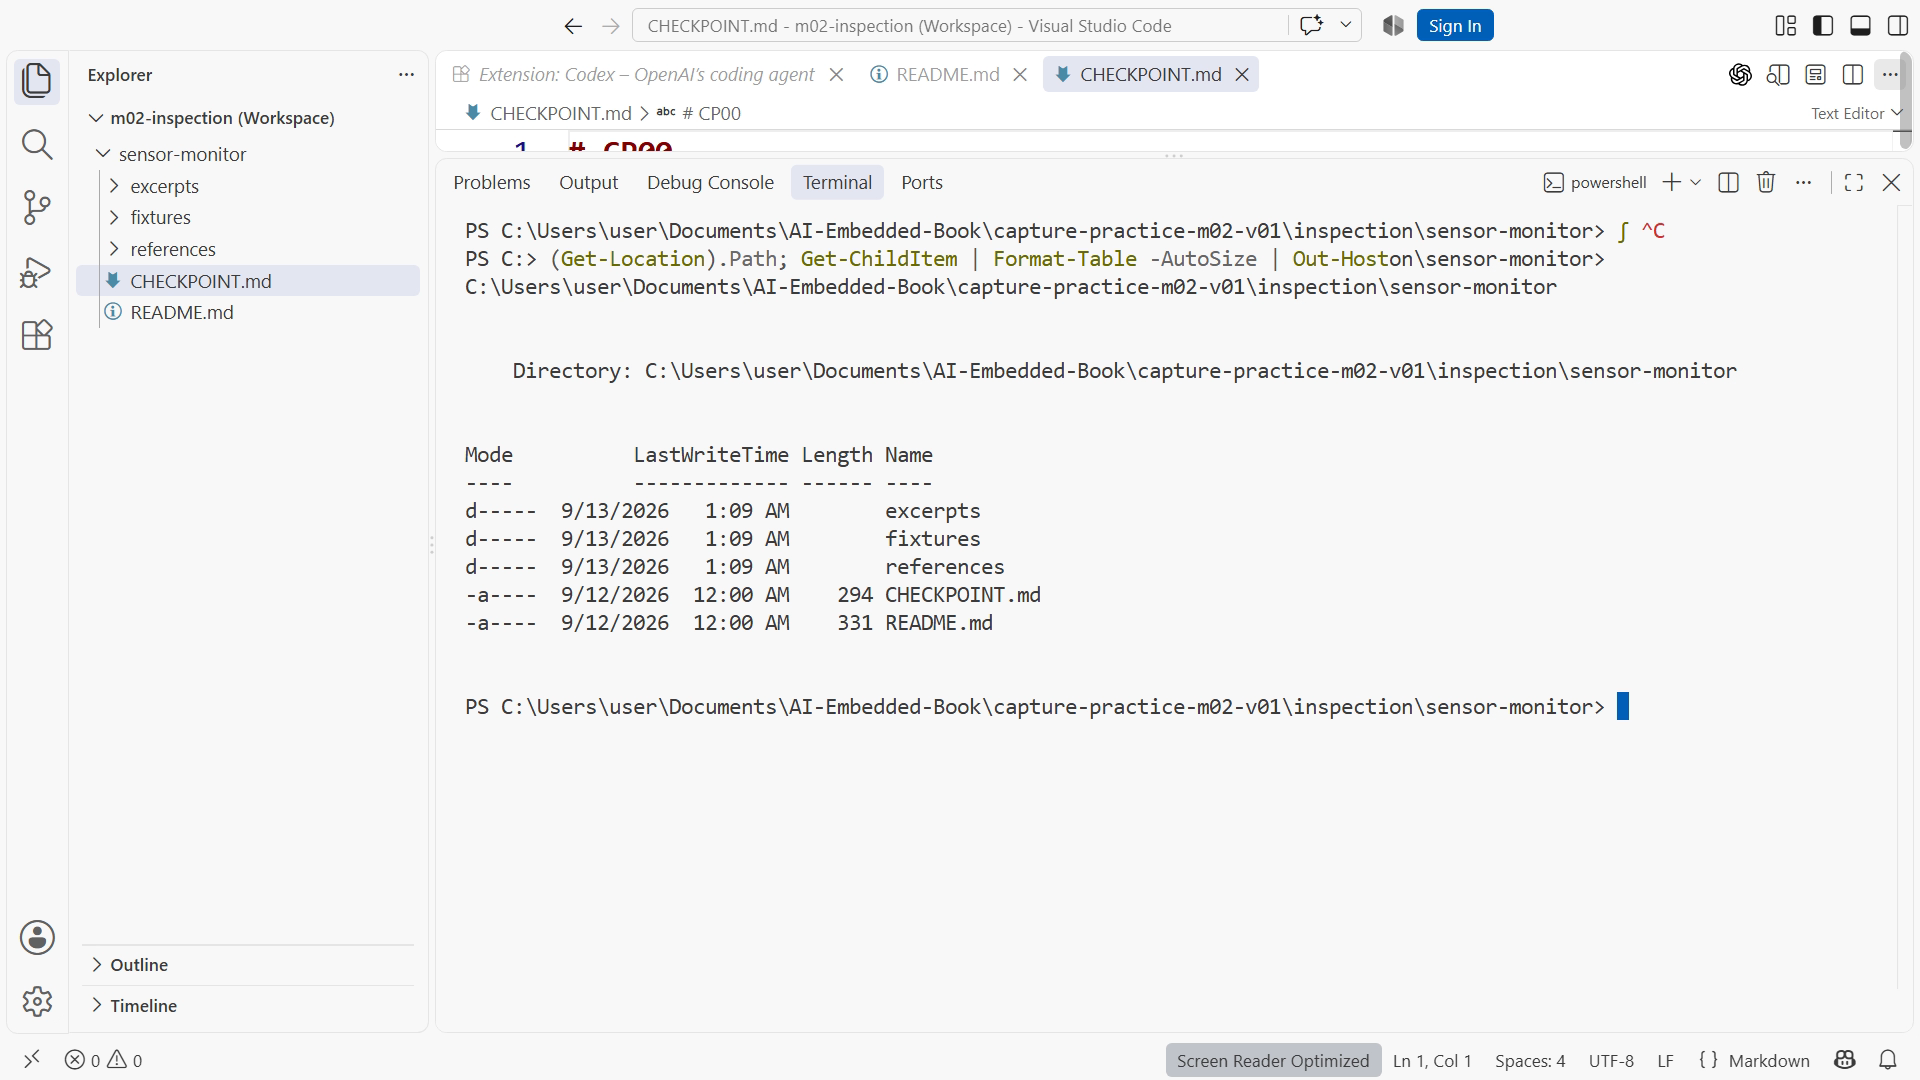
Open the extracted sensor-monitor folder in VS Code. The editor's active file and terminal working directory are separate state. In its integrated PowerShell terminal, run Get-Location and Get-ChildItem. Confirm the root against the checkpoint README before executing relative paths.
CP00 is an inspection packet. CP01 supplies the minimal executable host report and firmware build. From the CP01 root, use the documented Windows command wrappers:
.\scripts\replay.cmd
.\scripts\build-firmware.cmd
Run each separately and save its actual result. The replay compiles and exercises software with synthetic input. The firmware command cross-compiles for the recorded target and options. No upload or physical observation is implied. The .cmd path requires no PowerShell execution-policy change; follow the matching project's dependency and setup documents.
Recording note: Idle waits between the recorded replay/build commands and their results are shortened. The commands, actual results and exit state remain visible. CP01 prints one fixed synthetic sample at 25.00 °C; it does not parse the CSV fixture. The later artifact listing inspects retained build files, and the labeled output transcription preserves the original results.
Record Git, compiler, Arduino CLI, and core versions. A native host compiler and the target cross-compiler have different jobs. A command that starts successfully does not prove every dependency is installed. The setup record should distinguish tool discovery, replay result, and cross-build result.
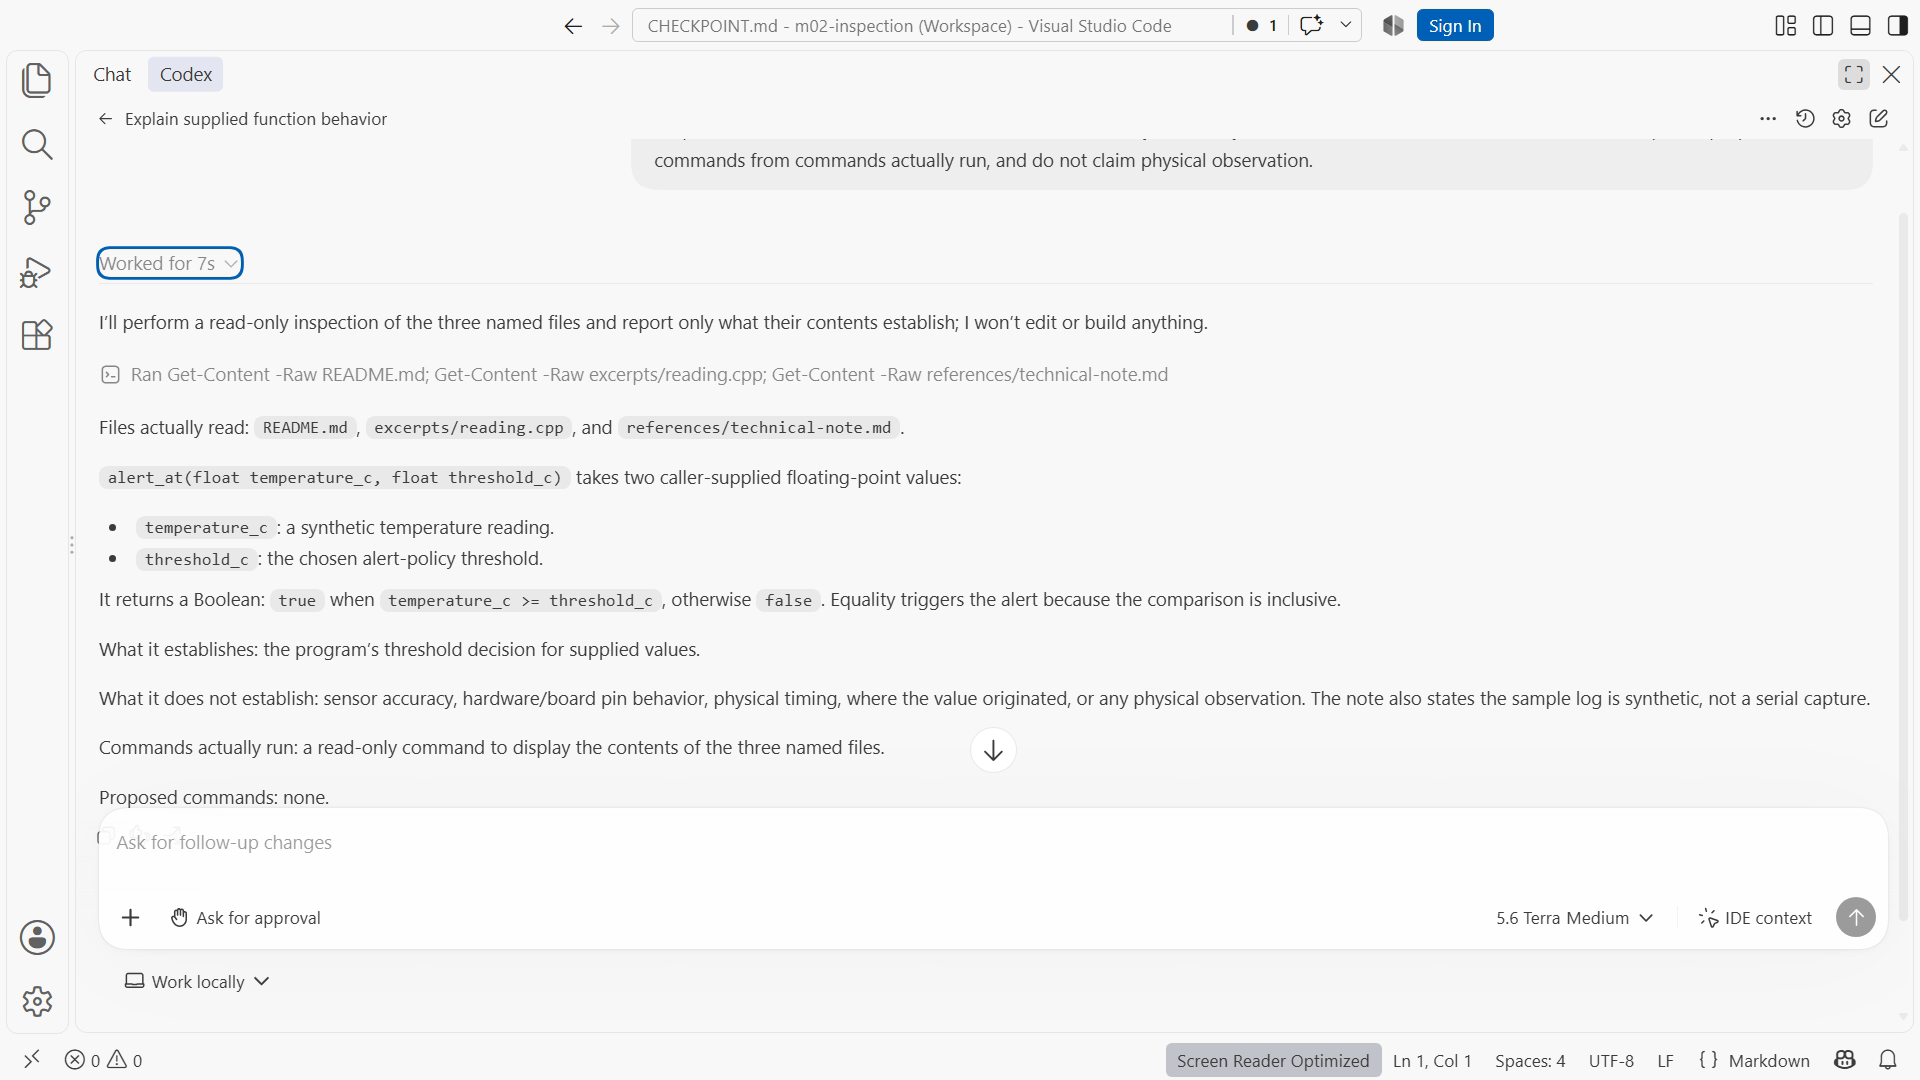
Ask the agent to read the README and introductory source, explain input/output, name the files used, and make no edits. Inspect the actual access controls and action record, then compare its claims with the open files. The official Windows sandbox documentation explains current runtime choices; do not substitute a prompt for actual controls. Codex Windows sandbox
If PowerShell cannot find a tool, use Get-Command and the documented installation location. If a program exits before printing, record its exit code and inspect the supported runtime path; do not change policy code to fix a loader failure. If the agent is limited, complete the local checks and leave that interaction pending.
Practice and completion
Complete the exercise, then compare your artifact with the separately distributed instructor answer. A lesson acknowledgment records your own progress; it does not certify that a physical test occurred.
Chapter 4. Resources: Project checkpoint guide and toolchain setup. Figure references: SS04-04–06.
Recording transcript
Our workbench is ready when we can connect an action to a known project and an observable result. In this lesson we will open the correct folder, run the applicable baseline, and ask the agent for a file-based explanation. The final artifact is a setup record with real results, not a checklist of installed icons.
Start by extracting the checkpoint into a new exercise folder. CP00 is the introductory inspection packet. CP01 contains the minimal executable host report and firmware build. Read the checkpoint note and README so that you know which activities apply. A later test suite may not exist in an early checkpoint, and that is an intentional part of the teaching sequence.
Use Open Folder in Visual Studio Code to select the sensor-monitor root. Inspect the Explorer. You should see the intended README and resource or source directories. If you see several unrelated projects, you probably opened a parent folder. Correct that boundary before giving an agent access or running commands with relative paths.
Open an integrated PowerShell terminal. Run Get-Location to display the working directory, then Get-ChildItem to list the contents. The file open in the editor does not determine every terminal's location. A command can compile another checkout while you are looking at the right source file, so this simple inspection prevents misleading results.
If necessary, use Set-Location with your actual extraction path in quotes. The example path in the written lesson is only a convention. Substitute your own path consistently. A dot means the current directory, and the scripts path in our commands starts from that directory. Keep the path intact when copying it; a visual line wrap in a page is not a new command.
Record the tools before running the baseline. Git reports its version, Arduino CLI reports its version, and the native compiler reports its version. The board core is a separate installed dependency. A native compiler creates the host program that runs on your computer. The target toolchain cross-compiles firmware for the documented embedded board. They establish different results.
Follow the project's setup document for supported locations and versioned dependencies. The primary Windows entry points use command wrappers ending in dot cmd. They can be launched from PowerShell without changing PowerShell's script execution policy. The wrappers also manage the documented process-local runtime path. Keep the selected tool distribution intact instead of moving individual executables around until something appears to work.
From CP01, run the replay command shown in the lesson. It builds the host program and prints one fixed synthetic sample at twenty-five degrees. The CSV parser and shared policy arrive later; this baseline does not read the fixture. Read the actual output and capture the exit result. The word synthetic belongs with this evidence. A successful host run says something useful about software behavior, but it is not an observation from a connected sensor.
Run the firmware build command separately. The script supplies the recorded target configuration, including relevant board options. Inspect the actual completion result and generated artifacts. Do not assume the build passed because the replay passed: they use different compilation paths. Likewise, a cross-build does not mean firmware was uploaded or that USB communication and electrical operation were tested.
If a command fails, preserve the diagnostic and context. A missing tool can be investigated with Get-Command and the documented installation path. A program that exits before printing may have a runtime dependency issue. A compiler diagnostic may point to source or target dependencies. These are distinct failures; changing the policy comparison is not a remedy for an executable loader problem.
Now open the agent interface and inspect its actual access configuration. Identify whether it may read files, edit within the workspace, run commands, or access the network. Product controls can change, so use the official documentation and the interface you have. The brief will request inspection only, but that wording is task guidance rather than a substitute for runtime permissions.
Submit a bounded request to read the README and introductory reporting source, explain the input and output, name the files used, and make no edits. Ask it to separate proposed commands from commands actually run. Watch the action record. If it uses a file, locate that file. If it gives an output claim, identify where the result came from.
Compare at least two claims with the open source. An explanation might correctly name a synthetic input but overstate physical validation. Preserve the useful statement and correct the unsupported one. If the agent claims to read a missing file, investigate rather than copying that file name into your notebook as if it existed. Your record should reflect observed actions, not only the final summary.
If you stop a task, inspect the state before resuming. Some actions may have completed before the stop took effect. Save useful work, identify what changed, and write the next brief around the remaining task. Stopping is a control action; it does not prove that no earlier action occurred.
Keep the complete baseline output in a small learner evidence file, then summarize the result in your setup note. If you shorten the displayed log for readability, state that it is an excerpt and preserve the original. A successful final line without the preceding command and target can be ambiguous. Likewise, a screenshot of source is not a record of execution. This is the first time our evidence habits meet a real toolchain, so make the connection explicit: named input, command, actual result, and a limitation. That structure will remain the same when the project gains tests and more complicated behavior.
Complete the setup record with the actual folder, checkpoint, versions, commands, results, and inspection review. Mark an account limit or incomplete baseline honestly. You are ready for the Git lessons when the project is in a known place and you can reproduce its applicable software check. Git will then help us inspect and preserve the small changes we choose to make.
Download transcript